Campaign details provide you with all of the data points you need to make the right decisions, whether you are in the concept validation test or conducting traditional ASO. Here's a quick rundown of all of the data points.
To view all of the data points, you need to unlock the campaign with credits. Credits are available as part of a paid subscription and can also be purchased separately. If you are on the free plan (Astronaut), you will have access to the winning variant and its conversion rate.
Overview
1. The Statistics tab contains a bar chart that displays the conversion rate for each variant as well as conversion rate for both decisive and exploring users.
2. Below the bar chart, you can see how likely it is that the winning variant will win again. If the test does not have at least 300 impressions per variant or the data between each variation is too narrow, the image below will be displayed instead:
In the Probabilities tab you’ll find our Bayesian model, which predicts the winner variation throughout the testing process. It calculates the probabilities based on our previous data which leads to more accurate and faster results.
3. As you scroll down, you'll find general information about each variation. You can see the number of unique impressions, installs, conversion rate, and time to install. Because all of the data points are unique, a person can only give one impression and download the game once, even if he or she sees the page numerous times. The distribution of decisive and exploring users is also shown. You can view the data for both user type by clicking on it.
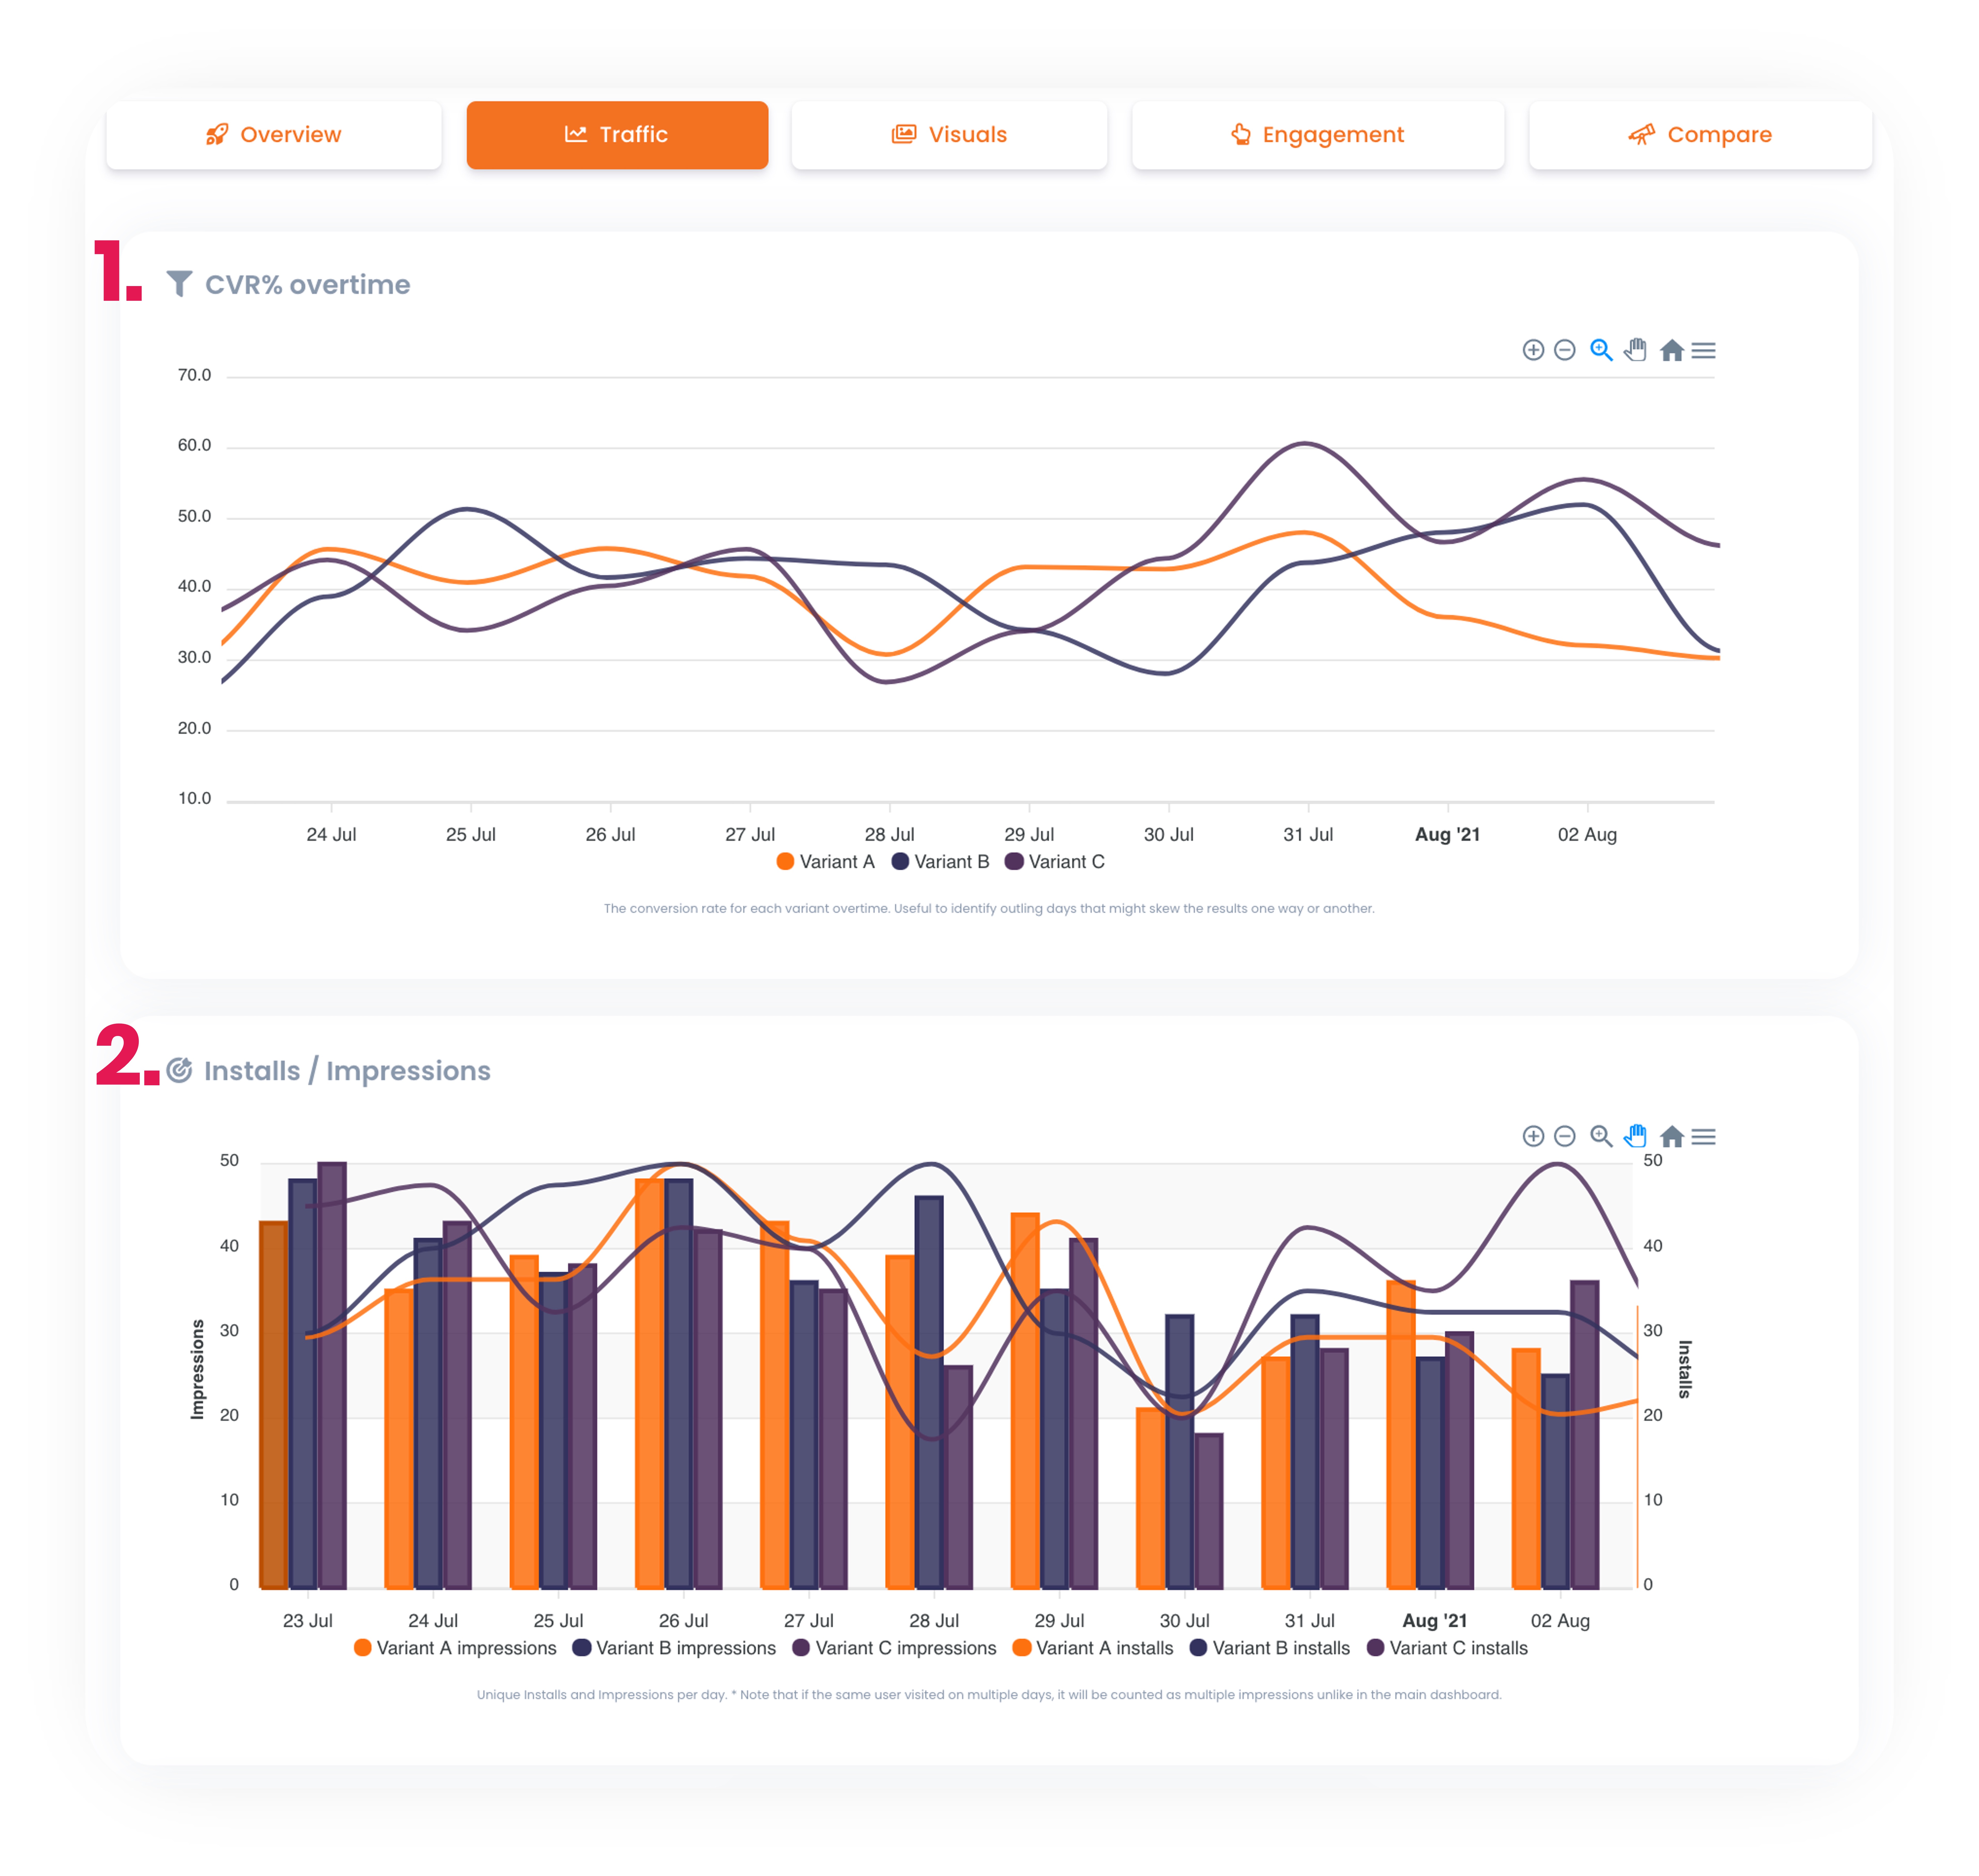
Traffic 📊📈
1. The daily conversion rate for each variant is shown here. This allows you to track how the conversion rate has changed over time. You can see if one variant has regularly performed well, while another one could have had varying days. CVR % overtime can help identify seasonality changes if the campaign is running for a longer period of time.
2. Impressions and installs are shown in an overlay bar and line chart. You can see the daily development in both in live data. This will help you identify if one variation is getting more traffic then the other's from the traffic source.
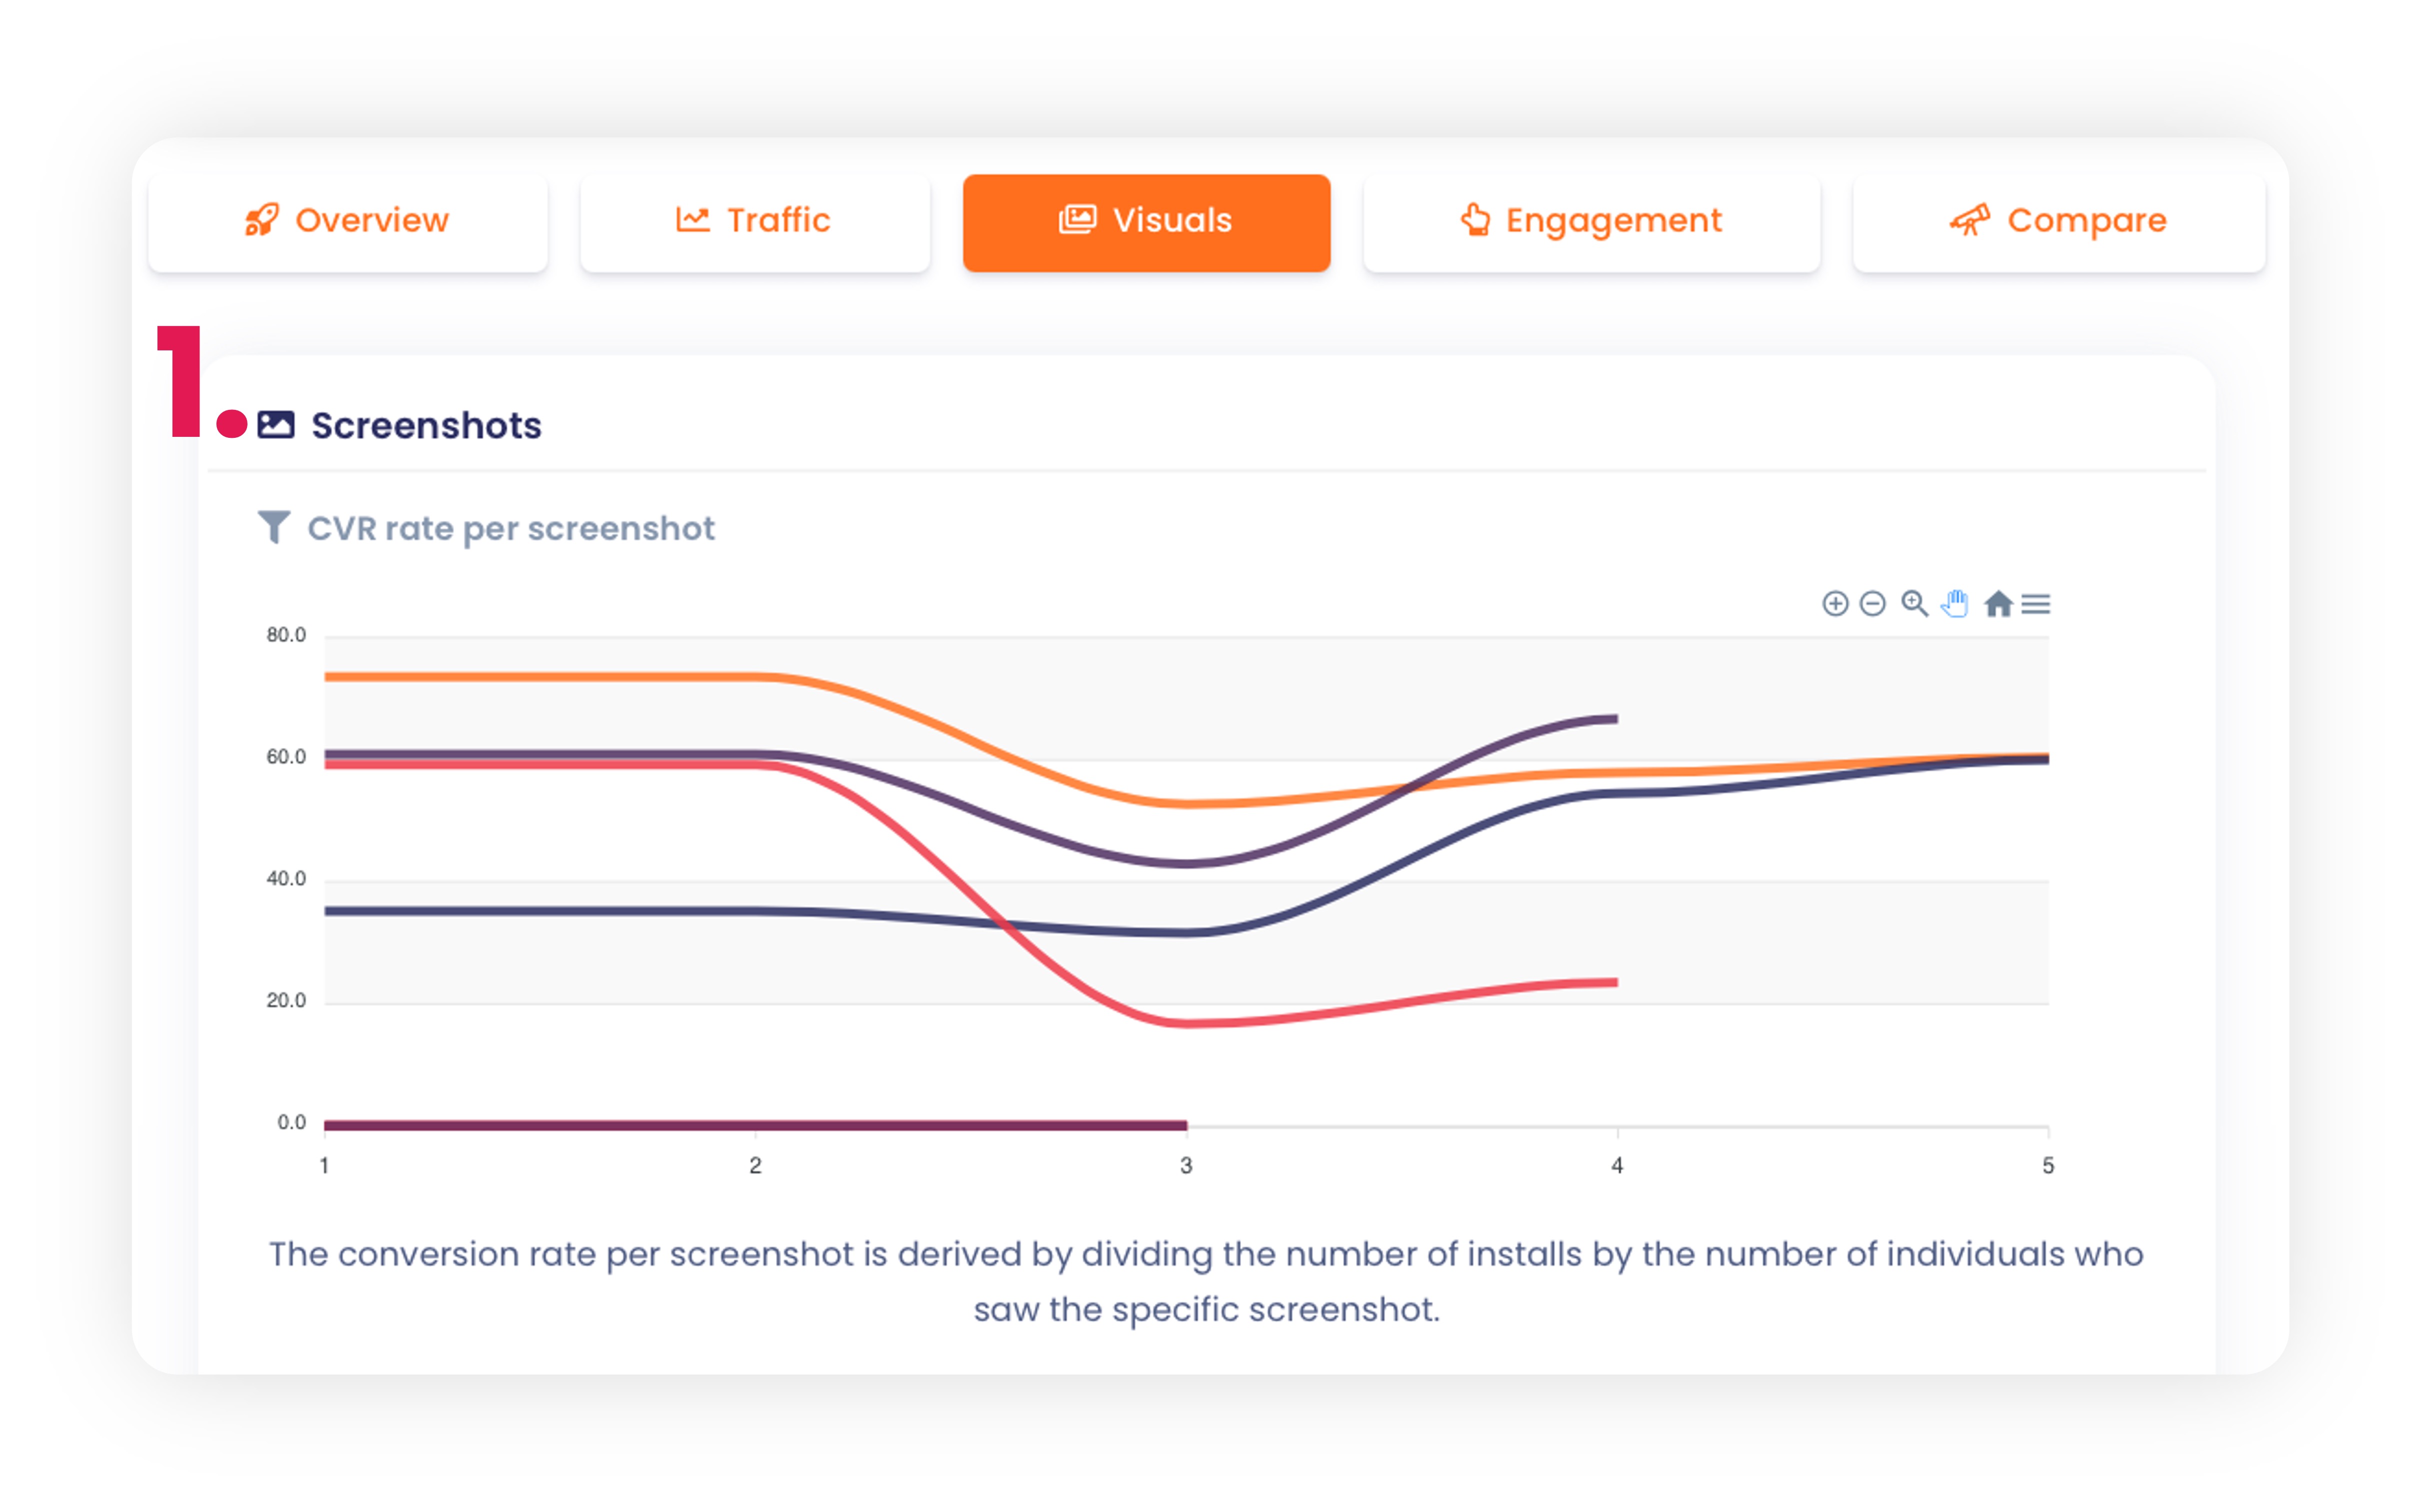
Visuals
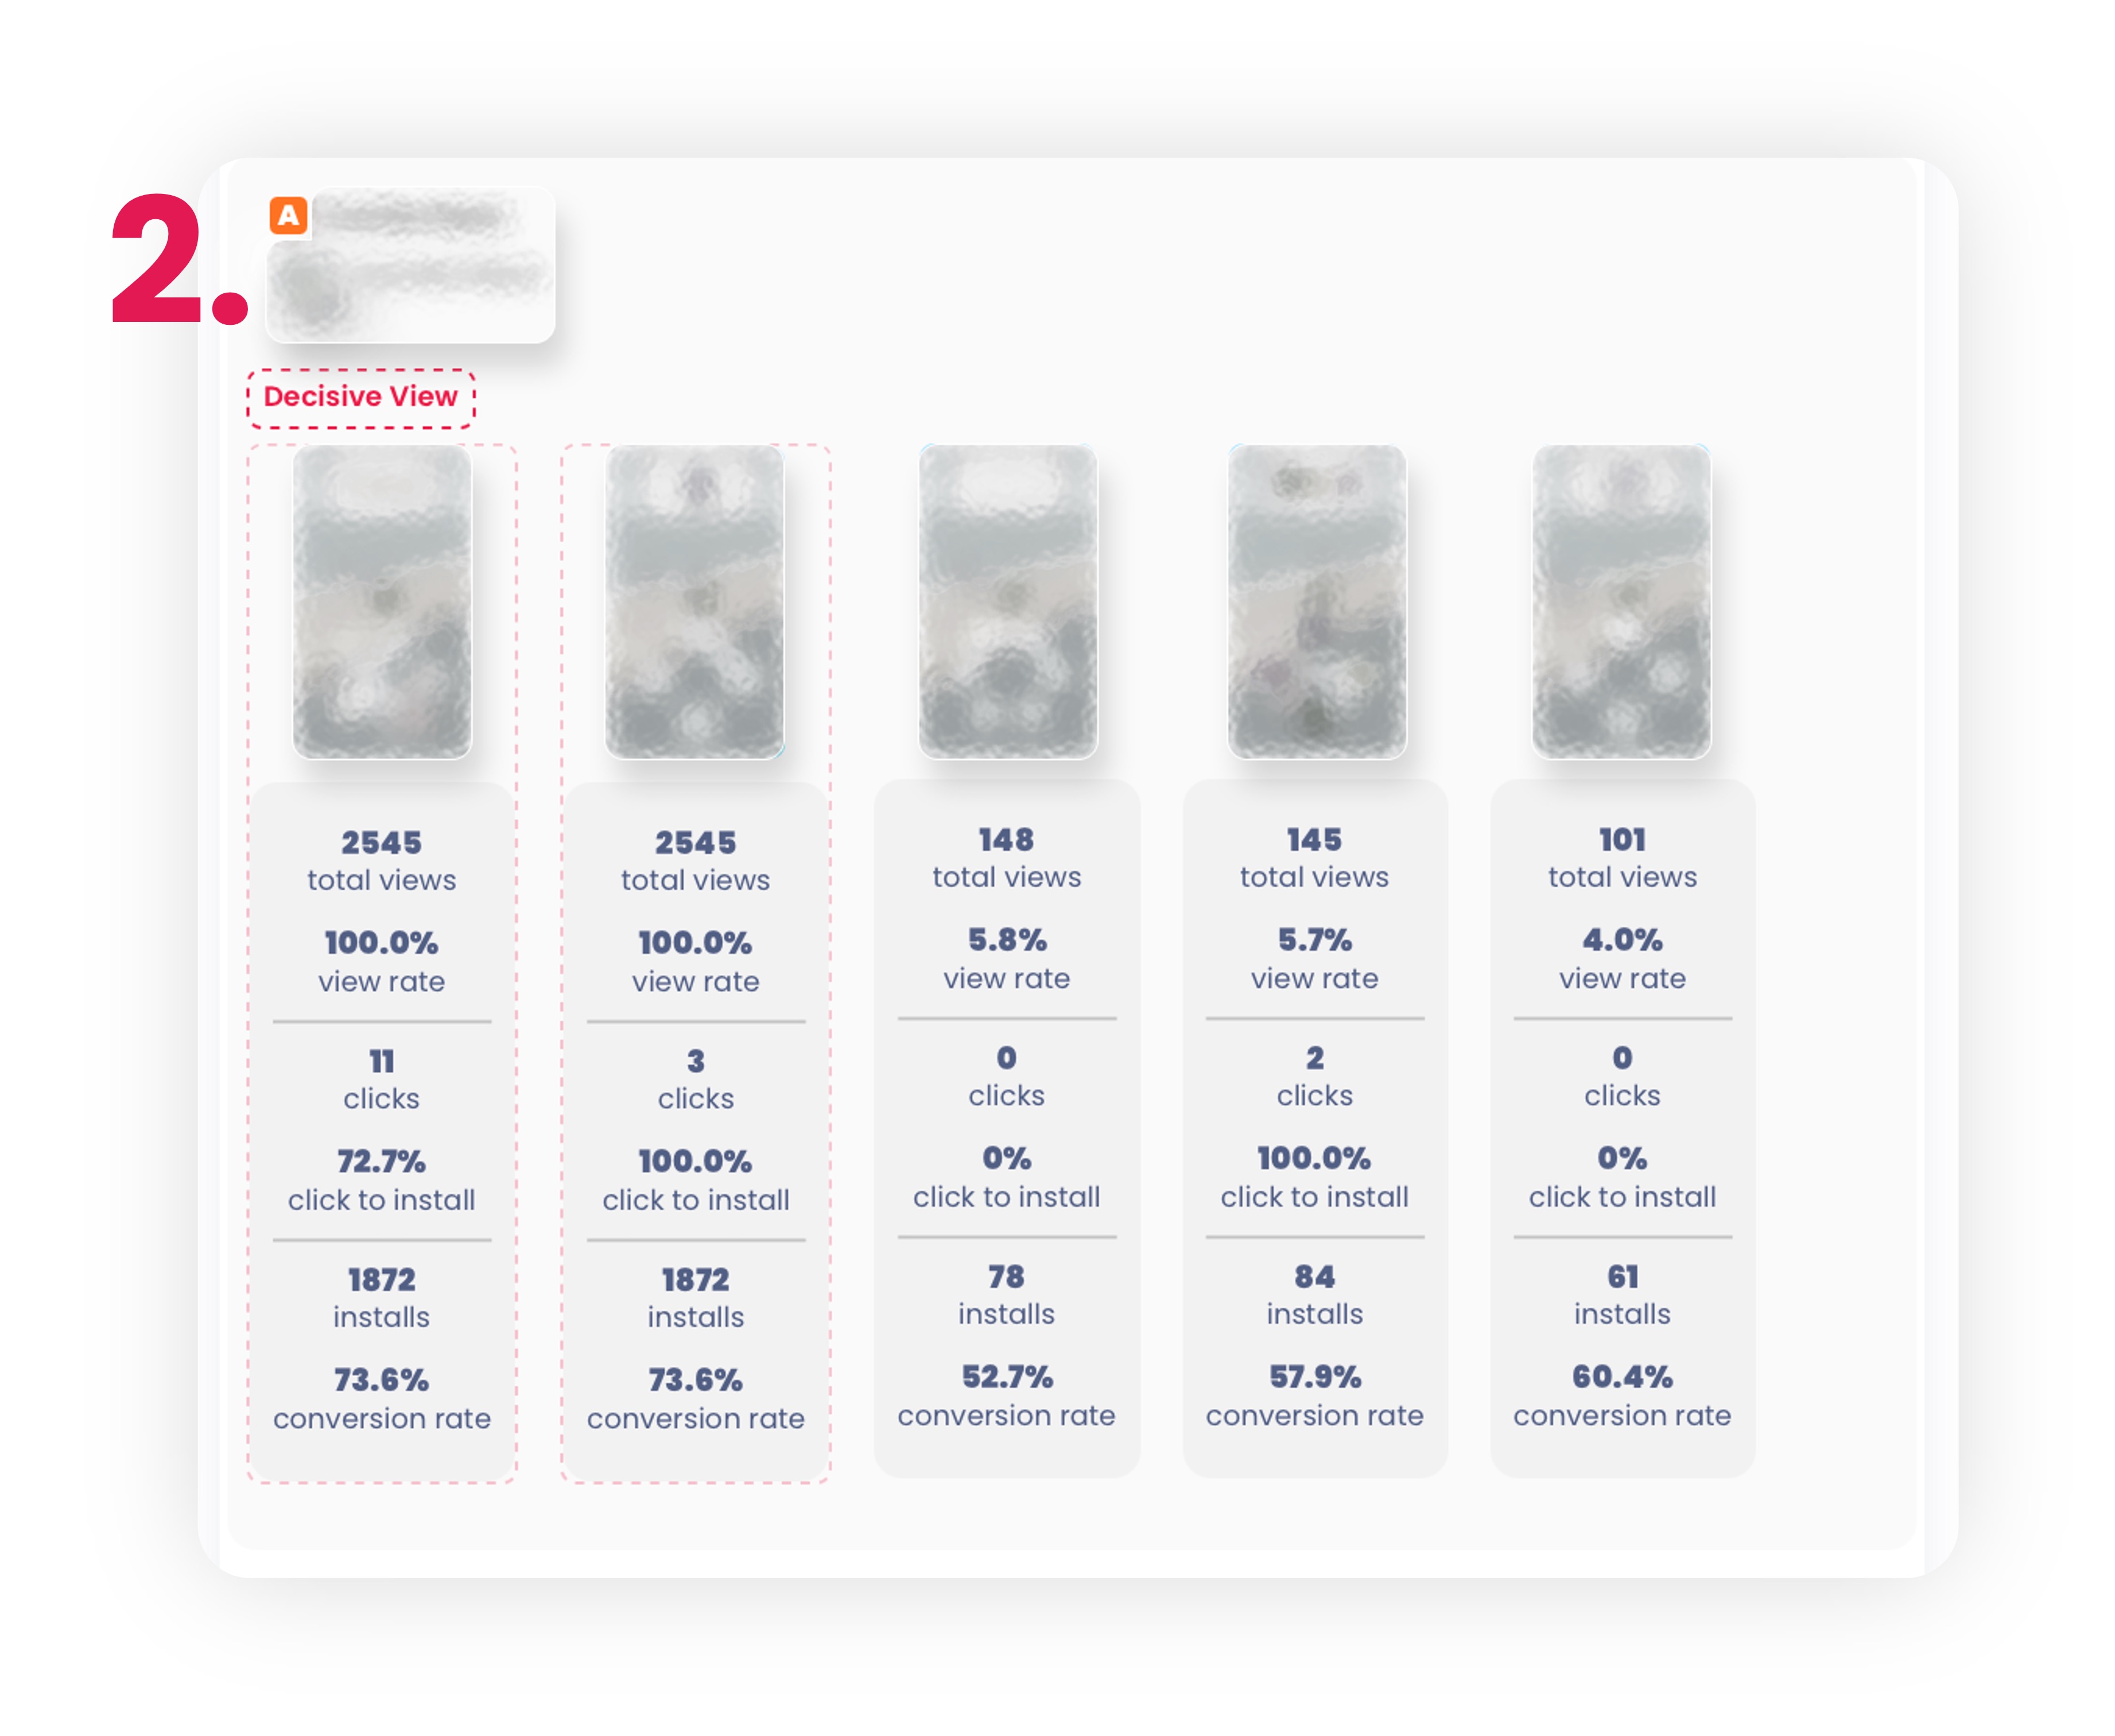
Note: The Decisive View is the view that the user sees when they first land on the page. The number of screenshots presented in the decisive view is shown by the red rectangle in the screenshots section.
1. The conversion rates per screenshot from every variant can be found here. In other words, you can track how many people downloaded the game after seeing the screenshot. The line charts will eventually differ after the first two screenshots because the first two screenshots are the decisive view in this case.
2. You can check the total number of unique views, clicks, and installs for each screenshot in each variant. This will help you figure out whether any of the screenshots worked successfully or not.
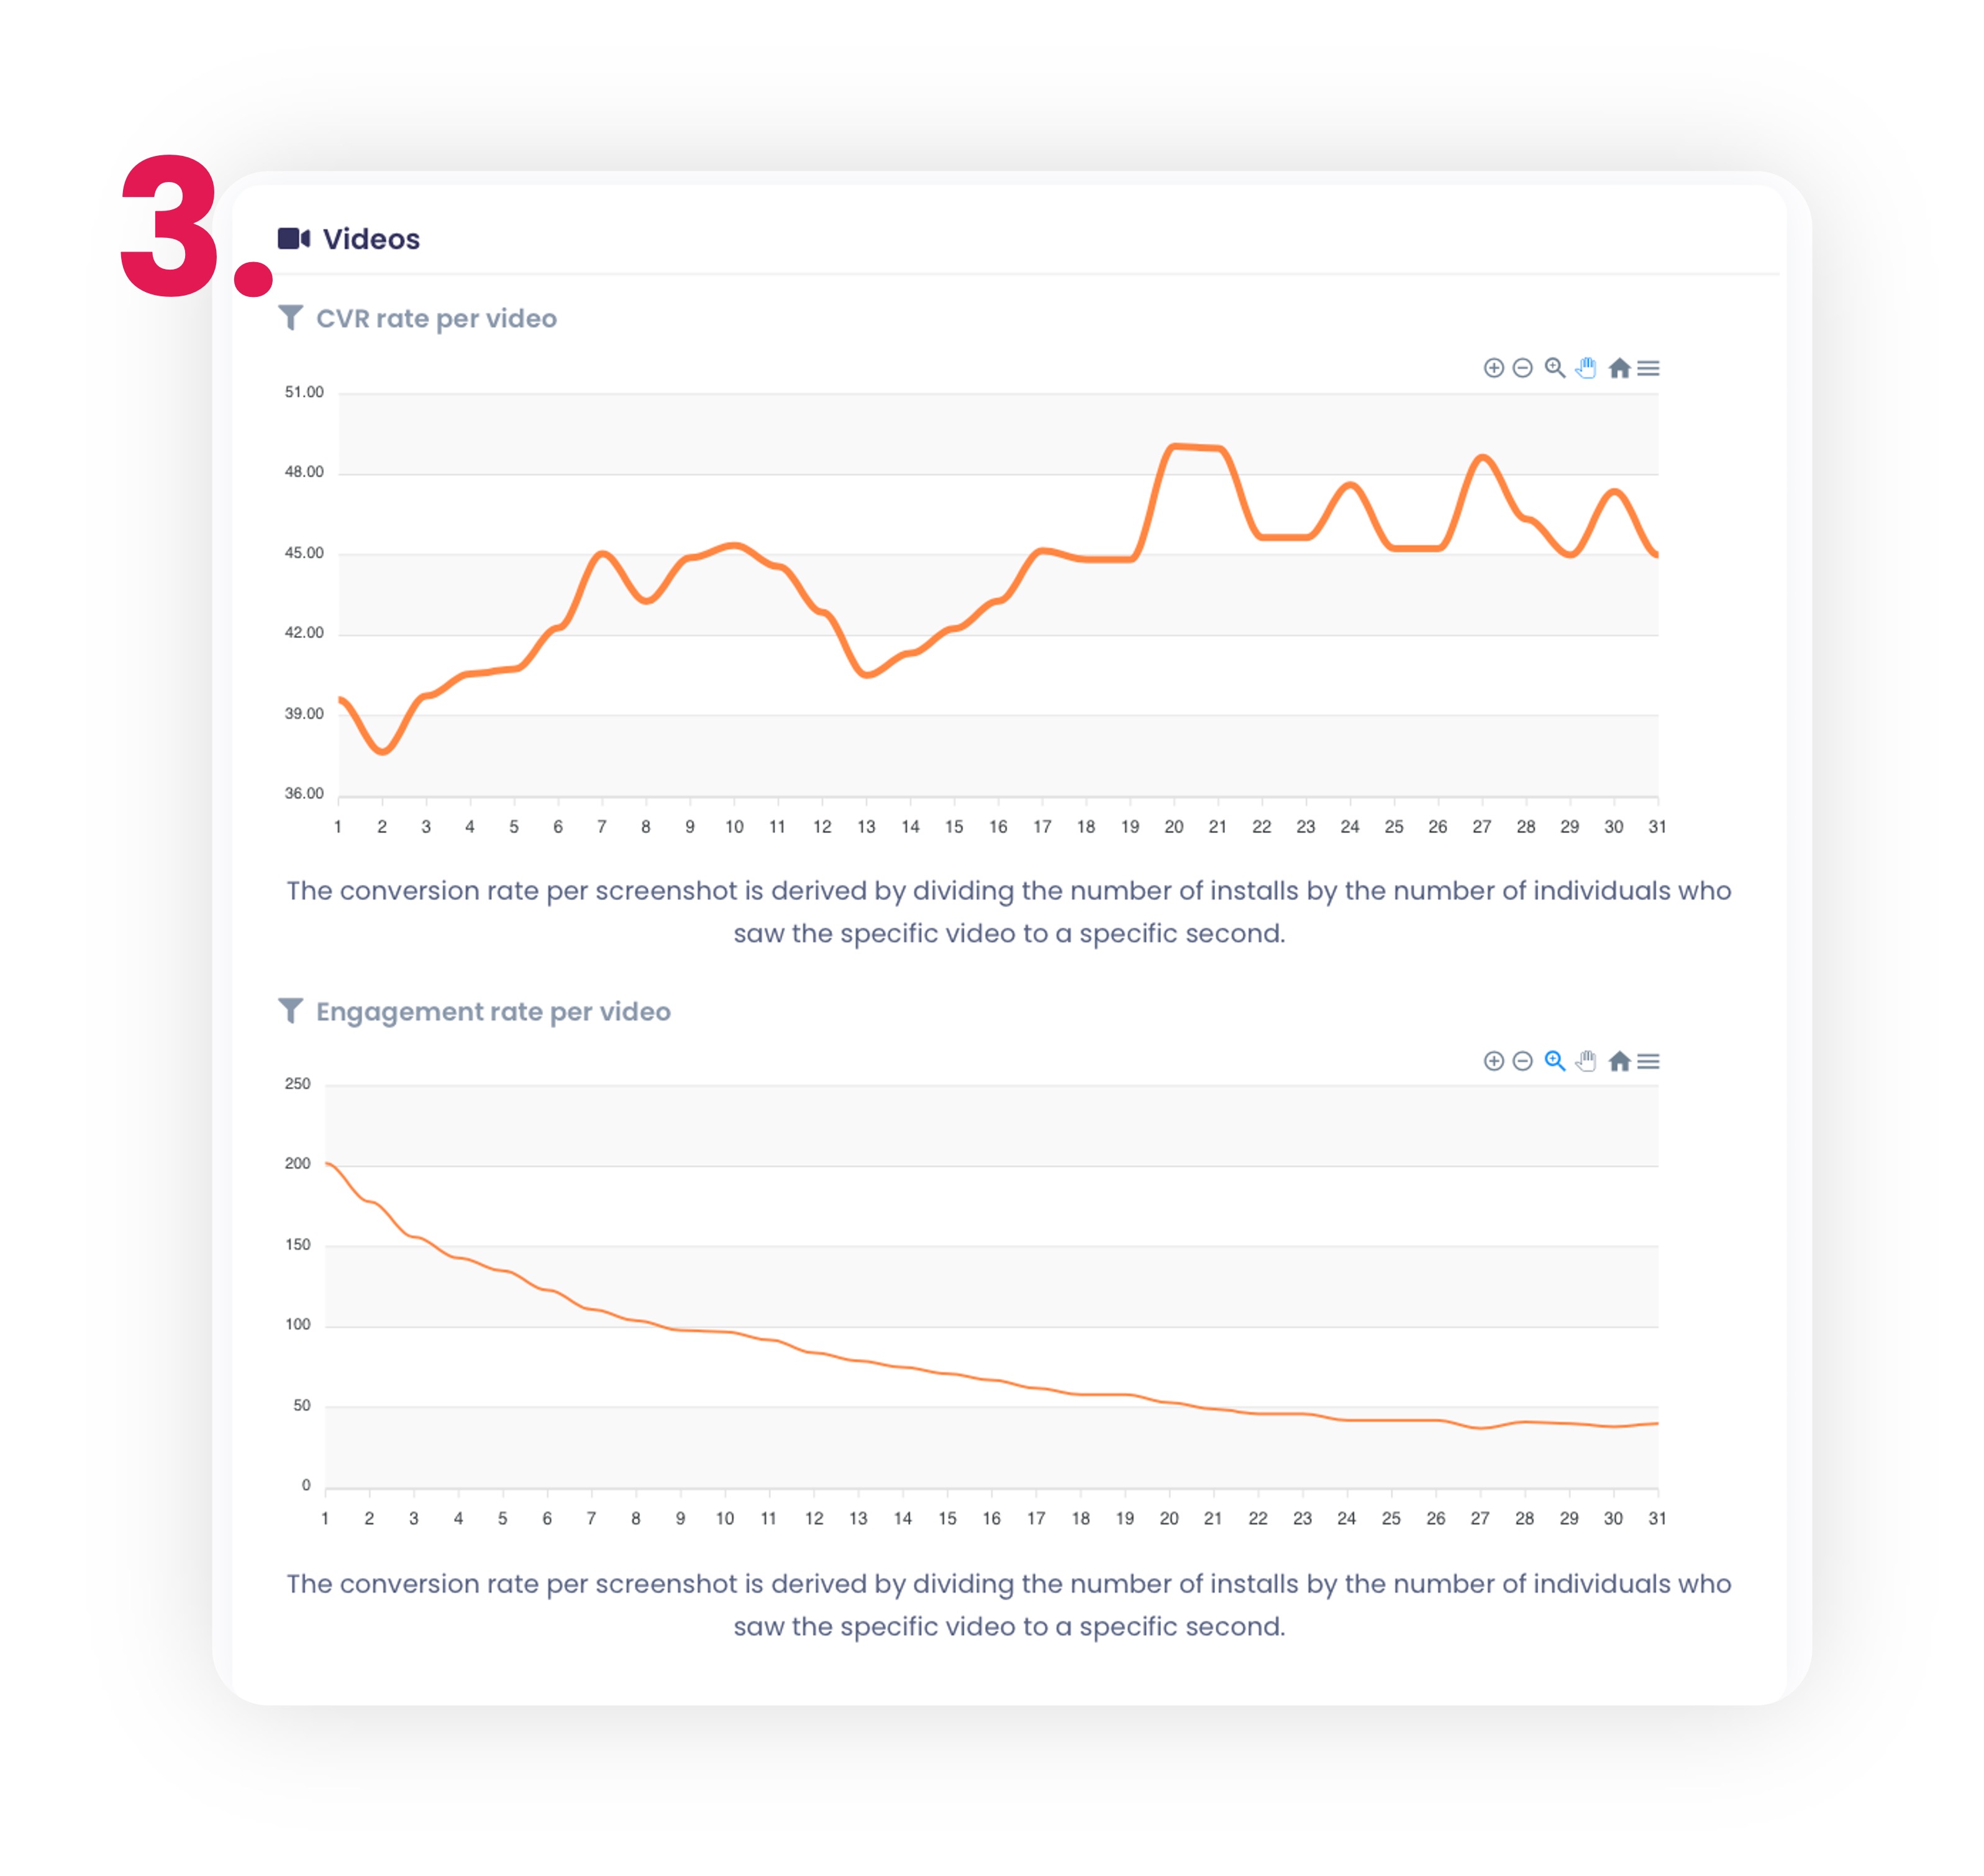
3. When using preview video you get also the data points for the video. In the first graph you can see how many people who watched the video until a certain point ended up downloading the game.
The next graph shows how long users watched the video before leaving. These help to identify the key points in the video that influenced the user's decision to download or not download the game.
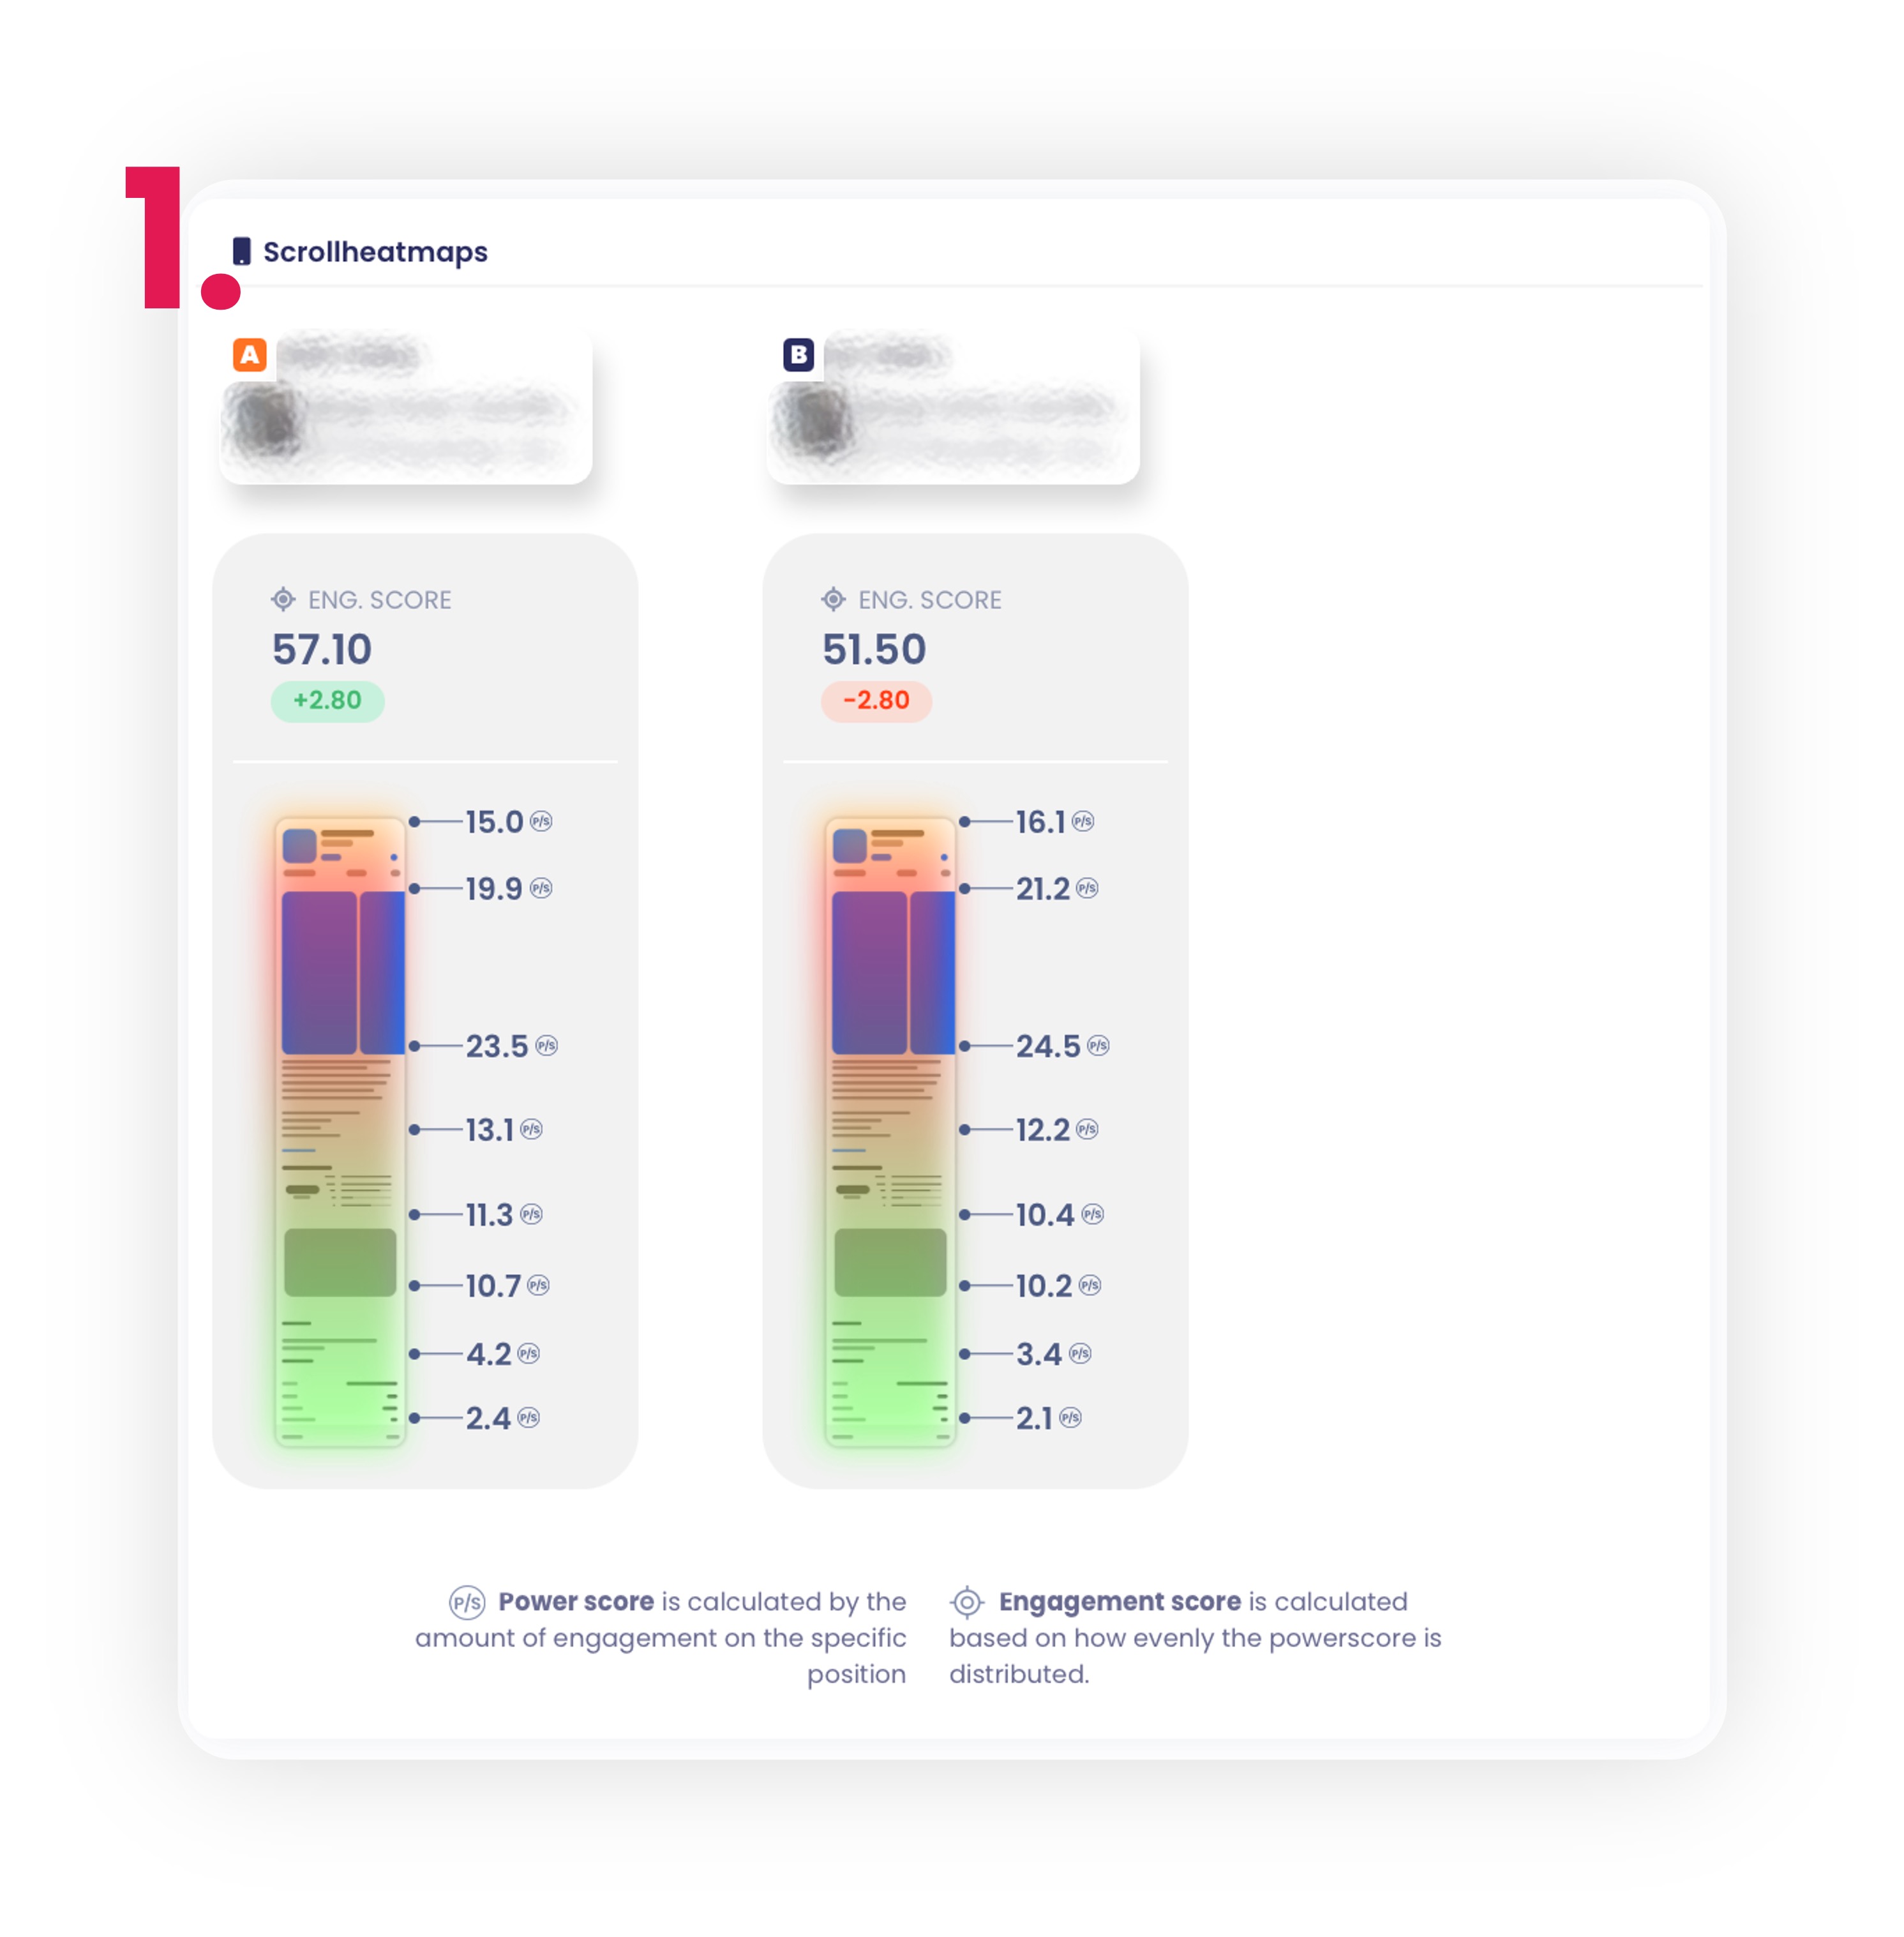
Engagement
1. The scroll heat map illustrates how users engaged with the store page. The power score indicates how much users interacted with different points off the page. The higher the score, the more they did in that given place. The engagement score indicates how evenly users spent their time on the look-alike page. With a score of 100, engagement was evenly distributed across all sections, and the lower the score, the more uneven the engagement was.
2. You can see how many times each option was clicked in the store page. This tells you how many people wanted to read the entire description, look at the ratings, or share the game with their friends. You can also see how many people clicked the exit button. This helps to examine how users engaged with your look-alike page and what made them to engage.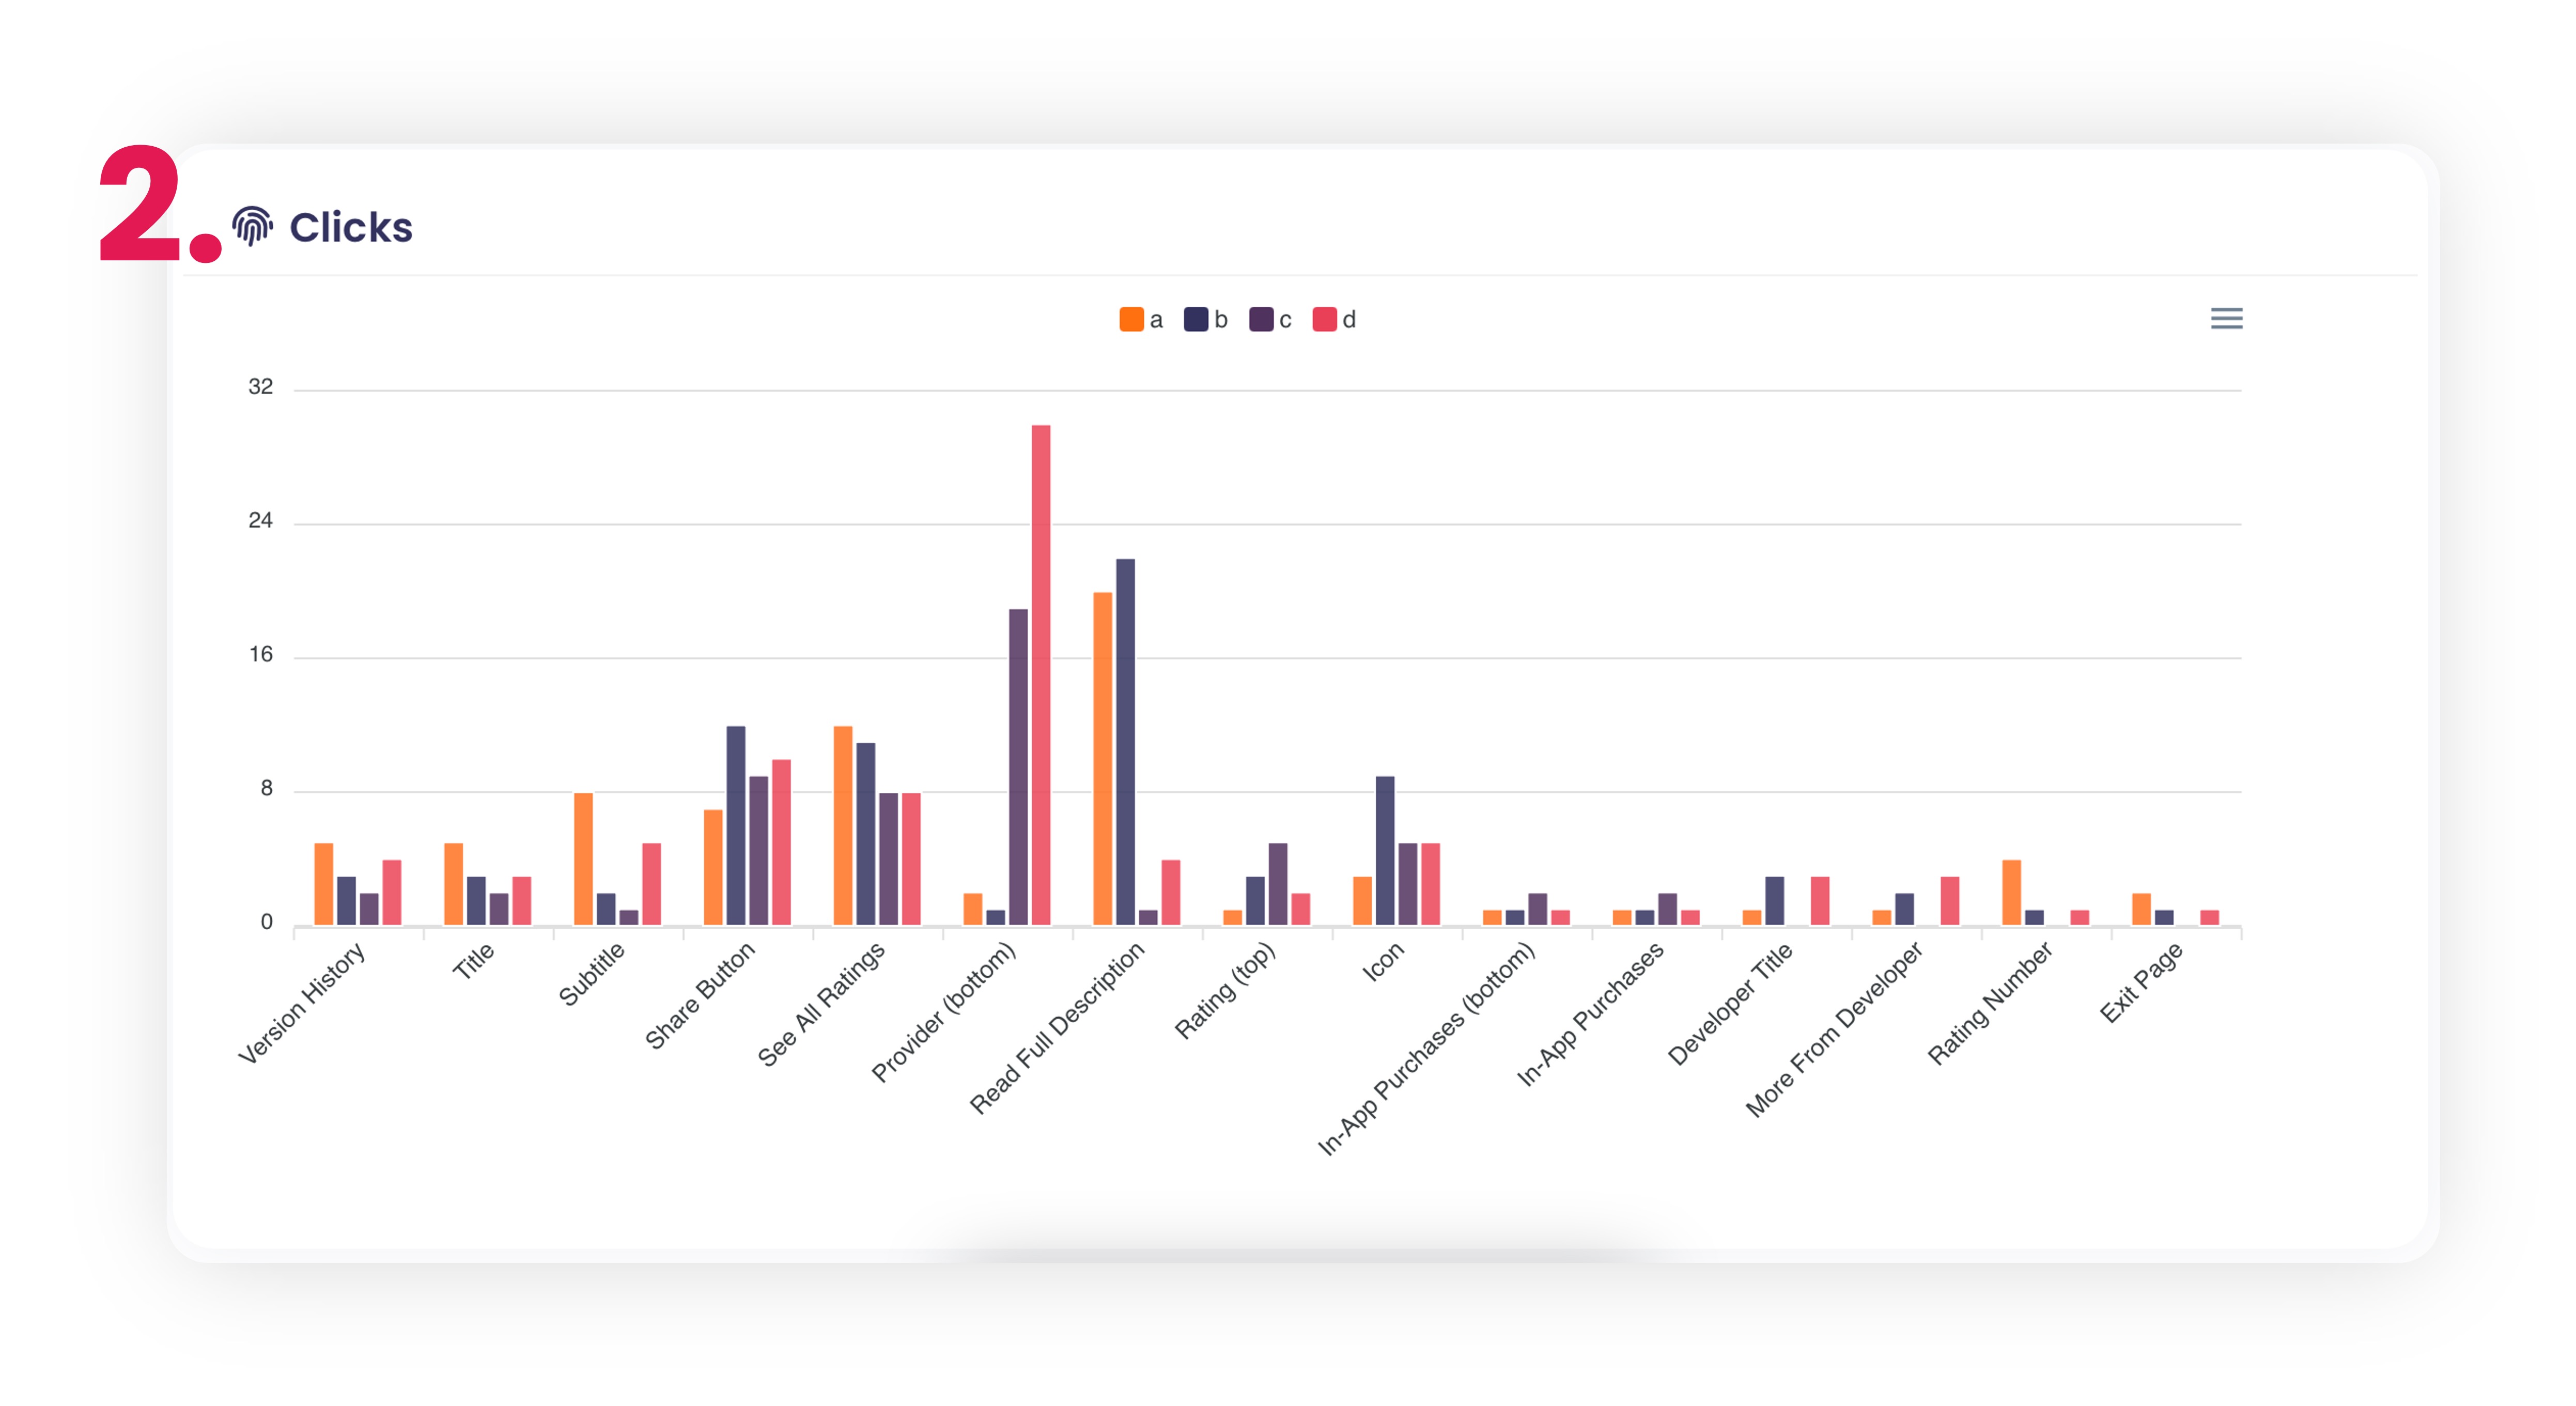
Compare
Here you can see all the variant screenshots side by side and compare them.